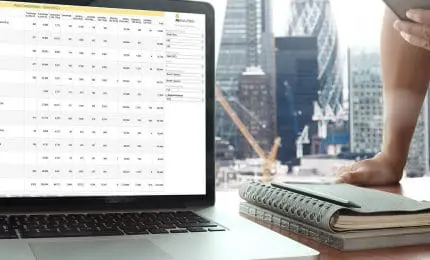
Gain market analytics & valuable insights & make swift responses to market changes with ease
INSPIREMED specialise in providing advanced data visualisation dashboards & analytical models to the healthcare sector.

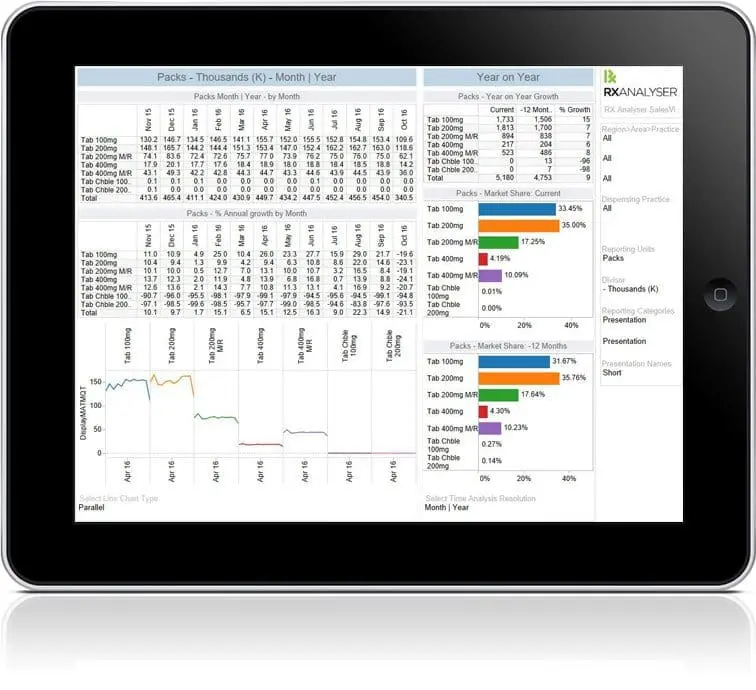
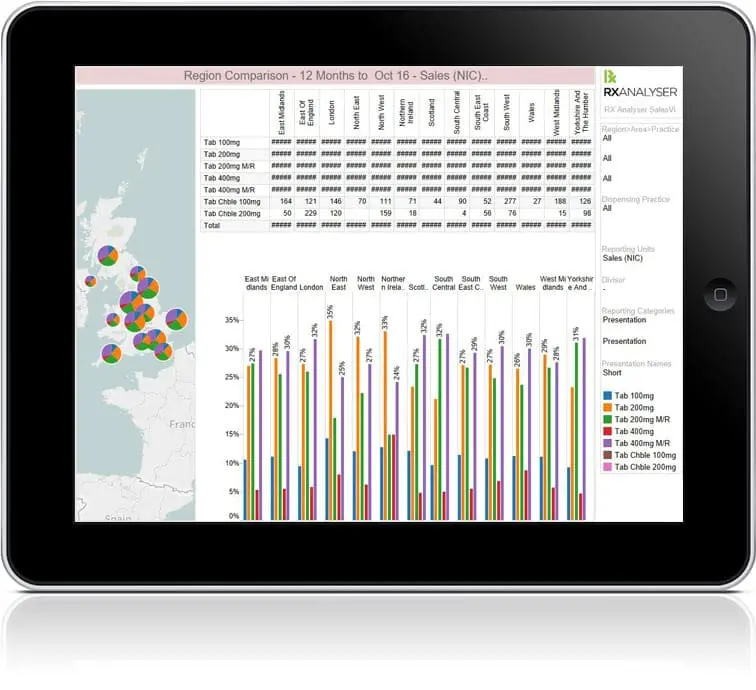
Versatile, elegant and simple to use, RX Analyser presents easy to navigate, enhanced analytics at the touch of a button.
Find out more
Innovative advice and expertise to develop data solutions, implementation and analytics. IM Consultancy supports your business strategy.
Find out more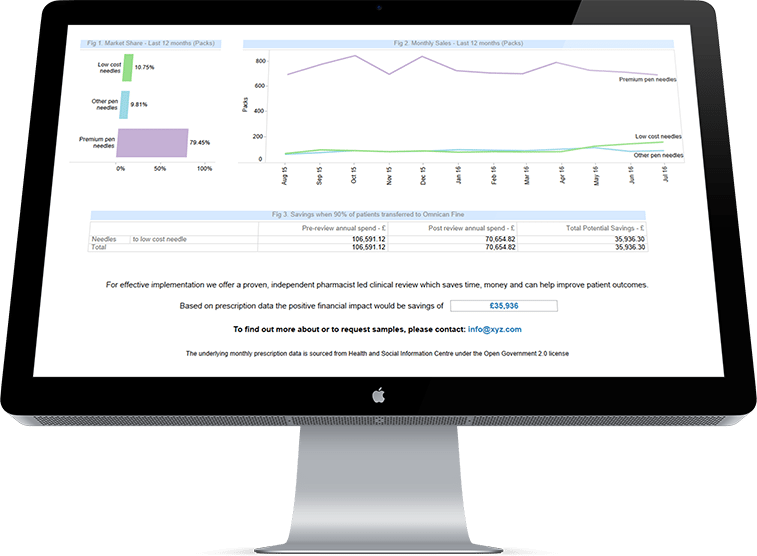
We make analytics simple
If I had to choose one feature about Rx Analyser it would be the market overview, which gives a great snapshot of the market from practice up to National level.
Sales and Marketing Manager, Leading Healthcare Company, 2016
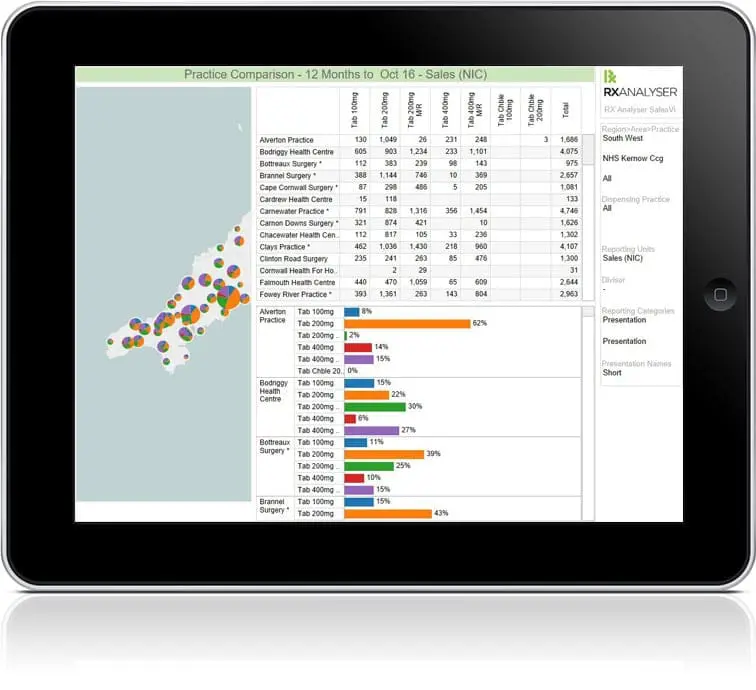
We chose Rx Analyser is because we wanted visibility of sales for our products. Rx Analyser is perfect for delivering a detailed level of data to practice level. The data is enabling us to set targets at territory level and assist our planning process as we can understand our competitor sales via Rx Analyser far better than previously.
National Paediatric Manager, UK Health and Wellness Company
One of the simplest dashboards I have used, this product is very flexible. We use it extensively to gain insight into our business, down to a CCG level.
National Sales Manager, Leading Pharmaceutical Company, 2016
Key benefits? Adaptability, flexibility for future changes and cloud-based.
General Manager, Global Healthcare Company
I recommend Rx Analyser. The product is a combination of software and service; the software is easy to use and quick to train, Inspiremed provide a high level of service in terms of data support and support.
National Sales Manager, UK Pharmaceutical Company
Working with Inspiremed is a great partnership experience and they make sure they understand your business, the industry that you are in and what you want to achieve in the use of the product.
National Sales Manager, UK Pharmaceutical Company

Technology moves fast
Future proof your business with Inspiremed's agile and intuitive next generation software. Stay ahead of the curve and drive your business forward.
Interpret sales data with ease
Access and interpret NHS and IMS and other sales data with ease with RX Analyser. Produce enhanced analytics, read and manipulate data, and make simple interpretations.
View data at a glance
The RX Analyser design is instinctive and highly visual. The platform displays chosen data at a glance. Make it easy to extract valuable interpretations and analyses.

Access the information you need
Cut data in myriad ways and access the information you need. Produce enhanced business intelligence. Visualise key metrics and actionable data at-a-glance.
